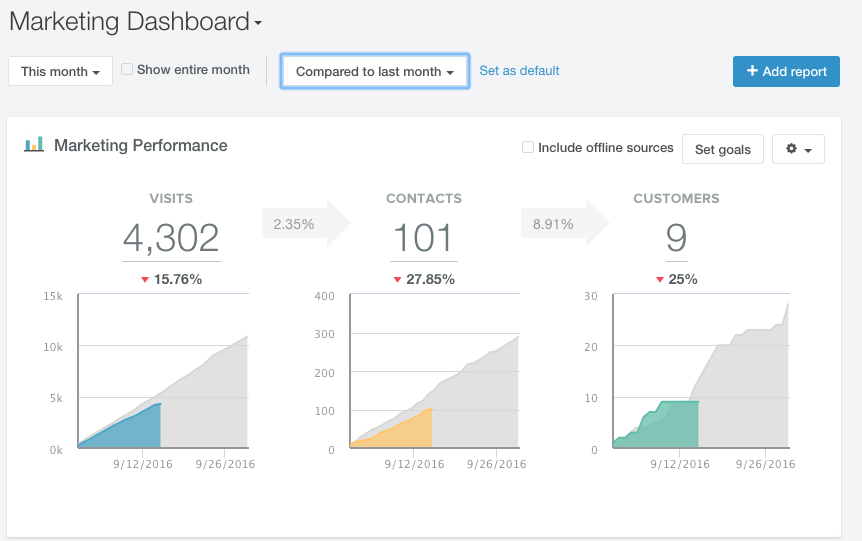
That is great. But what happens when you want to see the details?
If you’re down in visits month to date compared to last month, you’ll want to drill down and find out where. Is it organic traffic, paid, social or something else that is causing the drop? In order to take action you need to know which traffic source is down. But there is no way to get a report like that inside of HubSpot. Sources reporting will not show you side by side month to date comparisons. So we are forced to run two reports in separate browser windows and then line them up side by side and look for the changes. Ugh!
But wait, there is another way. Here comes Databox, a free tool you can plug in that solves for this, It is much easier to show you than to write about it so here is the video. It is only 4 minutes.
Sign up for Databox for free https://databox.com/signup
Have you tried this yet? There are hundreds of ways to use it. Would love to hear how you're using it


